Overview
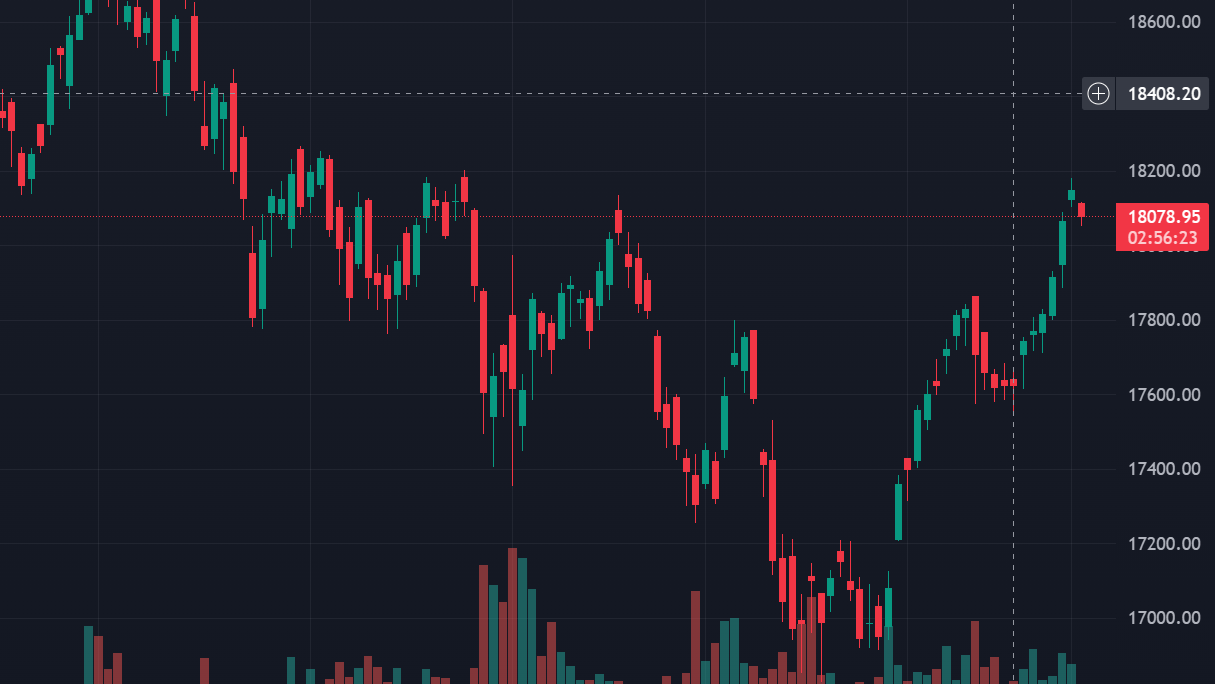
Candlesticks were originated in Japan and become popular and widely used as it provides insights into potential price movements. candlestick charts are widely used all over the financial world to make intelligent trading decisions to make an income for traders and investors. Candle stick charts can be analyzed in different time frames according to the trading style. For example, if you are an investor, you can analyse the chart of a stock with a Day candle time frame or weekly candle time frame. It helps to remove the intraday volatility from the chart and can make informed decisions in the market. An intraday trader can analyze the candle stick chart with 5-minute candles or 15 min candle to understand the intraday market movement and make income out of the market fluctuation. Candlestick charts are used in technical analysis to identify patterns and trends that can help traders and investors make informed decisions. By analyzing the shapes and trend of candlestick, investors and traders can understand whether the market or stock is in a buying momentum or selling pressure and can make trades accordingly. Let’s closely understand how to analyze a candlestick.
Candle sticks chart

- A representation of stock price movement chart that comprises of small units called Candles
- A Candle gives more detailed information on price movement happening.
- If analyzed well, it helps to understand the direction of price movement.
How To Read a Candlestick?
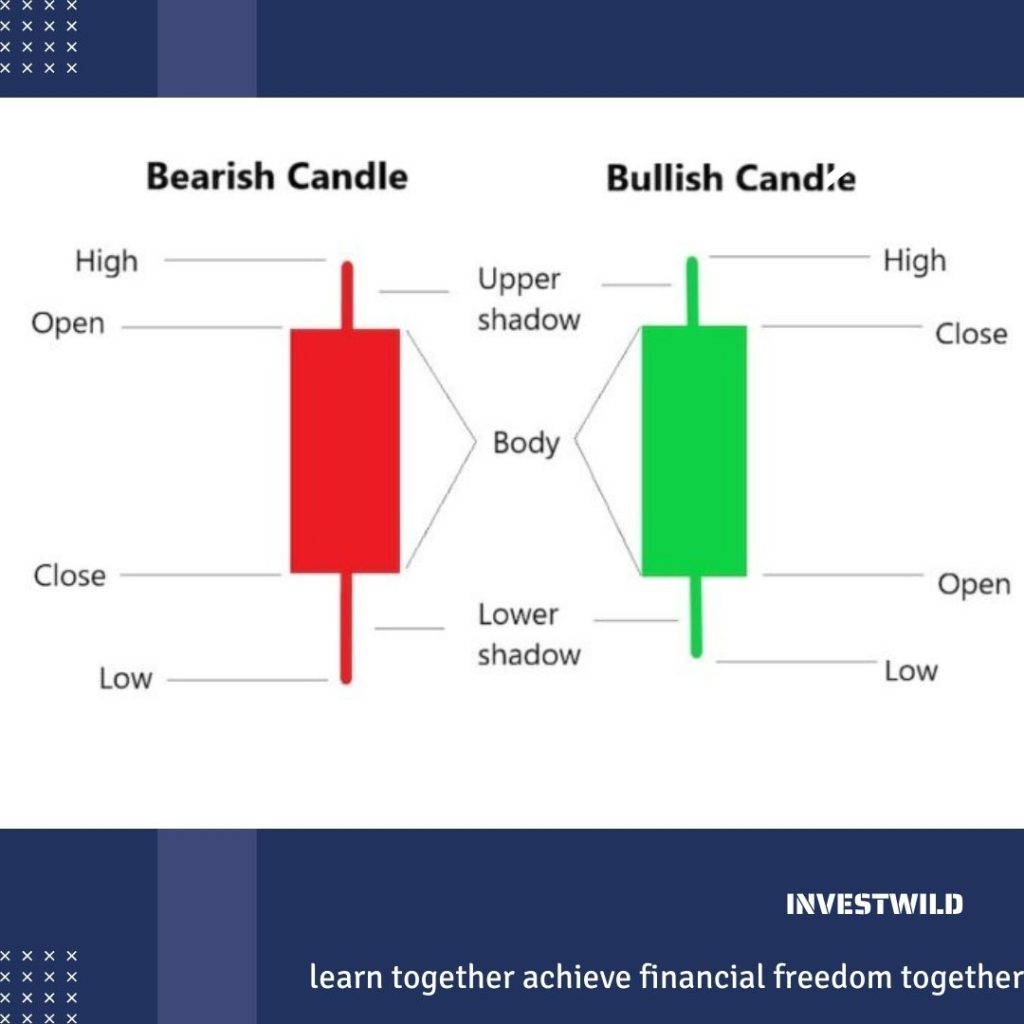
Candle stick is composed of a body and two lines (the wicks or shadows) that extend from the top and bottom of the body. The body of a candlestick represents the opening and closing prices of the stock, while the wicks help to understand the high and low prices of the financial instrument traded during the trading period.
Candlesticks are generally in green and red color; green color represents a bullish trend (closing price is higher than the opening price) and red color represents a bearish trend (closing price is lower than the opening price).

Candle represents price activity in a stock in a particular time frame
- A Japanese rice trader by the name of Homma Munehisa used candlesticks for the first time in the 18th century.
- It represents open price, high, low and close price in a specific time frame
- Longer the length, stronger the price action
- It can be of any colour based on the price movement – bullish or bearish – common green and red
Candle has the following parts
- The Central real body – The central real body is the body which is rectangle shape that connects the opening and closing price
- Upper shadow – upper shadow is the wick, that connects the high with the close/open
- Lower Shadow – lower shadow is the wick, that connects the low with the open/close
Bullish And Bearish Candle
• Bullish Candle of a stock price or financial instruments talks about the buying activity in a stock in a particular time frame. In a bullish candle the closing price of the financial instrument will be higher than the opening price. This represents more activity from buyers.
• Bearish Candle of any financial instruments talks about the selling activity in a stock in a particular time frame. In bearish candle, closing price of the financial instrument will be lower than the opening price. This represents more activity from sellers.
How to Analyze Candlesticks?
- Understand the candlesticks – The colour and shape of candle stick will provide more insights to traders and investors to make informed decisions in the market. There are different types of candlesticks and they provide prominent information to traders.
- Identify trend- The colour of the body can provide insights into the trend. In candle stick charts drawing trendlines helps to understand the trend and take intelligent positions accordingly.
- Consider the wicks- bigger wicks indicates rejections from particular support or resistance zones. The length of the wicks represents the volatility of the asset. Long wicks indicate high volatility, while short wicks indicate low volatility.
- Look for patterns- various patterns in candle stick can provides various insights to investors. Some of the commonly used patterns include Doji, Hammer, Shooting Star, and Engulfing. Analysing these patterns provides relevant insights to investors.


