Traders and investors use candlestick patterns to get an insight and to identify potential market trends. Single candle stick patterns and multiple candle stick patterns are popularly used tool by investors and traders. Multiple candle stick pattern has one or more candle stick in the chart that represents the change of asset’s price over a period of time. Both single candle stick pattern and multiple candle stick patterns are very relevant and they provide a visual interpretation of price action of an asset over period of time. Multiple candle stick patterns help traders to reduce losing trades and improve accuracy of trades. By proper analysis traders can confirm the trend and maintain a good risk management in trading.
CANDLESTICK PATTERNS
Single Candlestick Patterns
When it comes to single candlestick pattern, the trader gets relevant insights from just one candlestick to identify a trading opportunity. However, when analyzing multiple candlestick patterns traders or investors uses multiple candlesticks to identify a trading opportunity This means the trader will get more insight when analyzing multiple candlesticks at same time. To learn in detail about single candle stick pattern checkout this article.
- Marubozu
- Spinning Tops
- Paper Umbrella
Multiple Candlestick Patterns
- Engulfing Patterns
- Partial Engulfing Patterns
- Harami Patterns
- Gap Based Patterns
ENGULFING PATTERNS
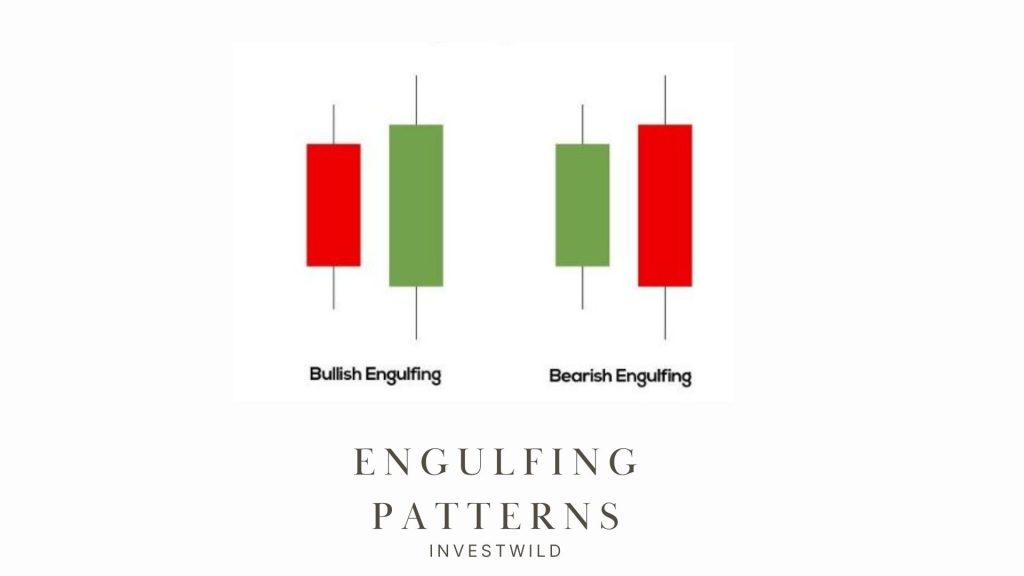
Engulfing pattern is a two-candle pattern. Both bullish engulfing candle and bearish engulfing candle indicates trend reversal. This happens when the second candle completely engulfs the first candle.
Bullish Engulfing Pattern
Bullish engulfing pattern indicates trend reversal in asset from bearish trend to bullish.
- The current trend of the asset should be downtrend
- The first day candle of the bullish engulfing pattern should be a red candle reconfirming the bearishness in the market.
- The candle on the 2nd day candle should be a green candle, long enough to engulf the red candle.
Bearish Engulfing Pattern
Bearish engulfing pattern indicates trend reversal in asset from bullish trend to bearish trend.
- The current trend of the asset should be downtrend
- The first day candle of the bearish engulfing pattern should be a green candle reconfirming the bullishness in the market
- The candle on the 2nd day should be a red candle, long enough to engulf the green candle
PARTIAL ENGULFING PATTERNS
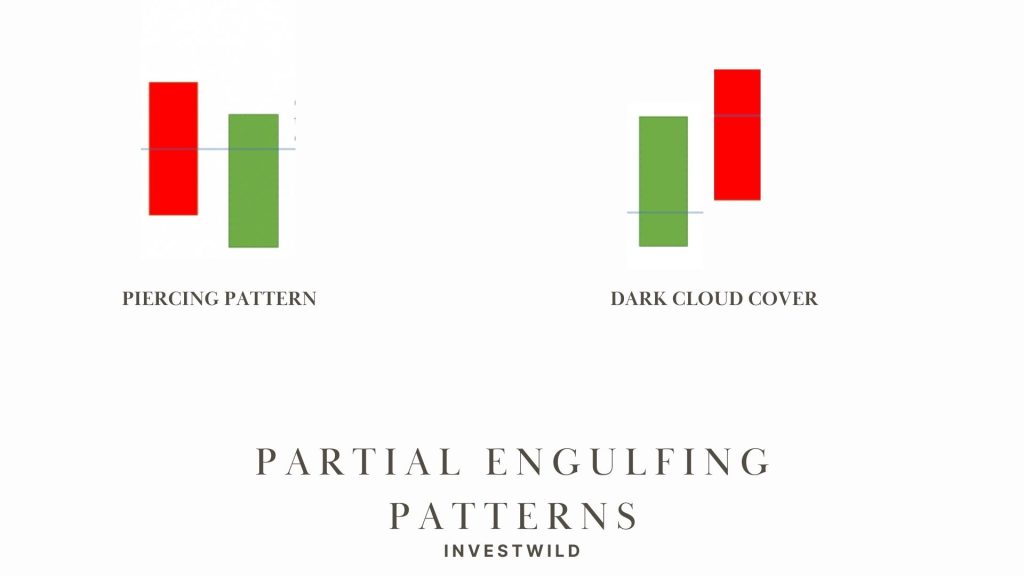
Partial Engulfing pattern is also a two-candle pattern. Partial engulfing pattern indicates trend reversal and is similar to Engulfing Patterns. Partial engulfing pattern happens when the second candle partially engulfs the first candle.
The Piercing Pattern
Piercing pattern indicates trend reversal in an asset.
- The current trend of the asset should be downtrend
- The first day candle of piercing pattern should be a red candle that confirms the bearishness in the market.
- The candle on the 2nd day of pattern should be a green candle, long enough to engulf 50% to 100% of the red candle.
The Dark Cloud Cover
- The current trend of the asset should be downtrend
- The first day candle of the dark cloud cover pattern should be a green candle that confirms the bullishness in the market.
- The second day candle of dark cloud cover pattern should be a red candle, long enough to engulf 50% to 100% of the green candle.
HARAMI PATTERNS
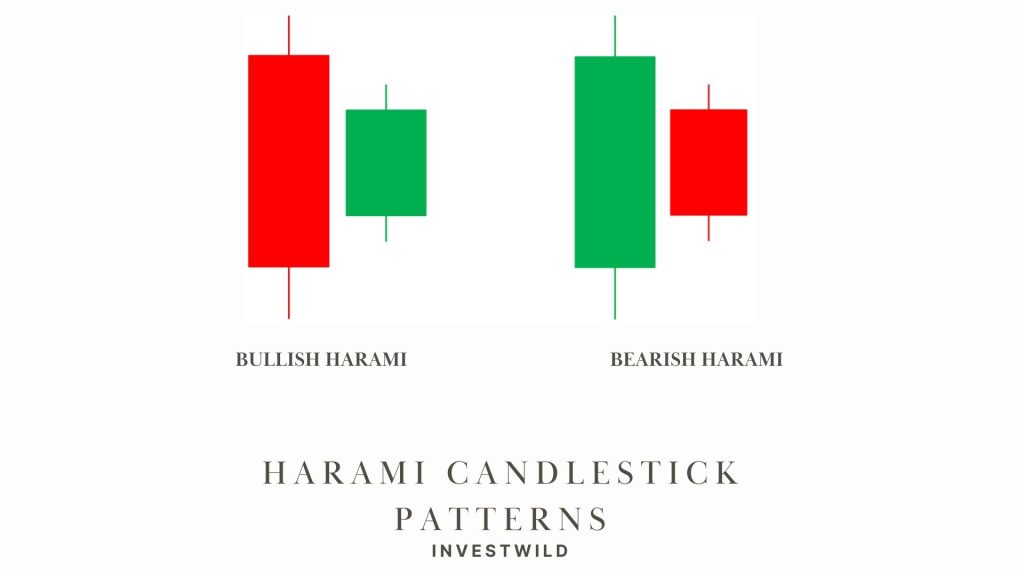
Harami candle pattern is a two-candle pattern. The first candle will be long and the second candle has a small body. Harami patterns indicates trend reversal of an asset. The second candle is normally an inside candle and looks like a pregnant lady. “Harami” is derived from an old Japanese word Harami which means pregnant.
Bullish Harami Pattern
Bullish Harami has a smaller green candle inside the previous red candle
- The current trend of the asset should be downtrend
- The first day candle of the Bullish Harami pattern should be a red candle that confirms the bearishness in the market.
- The second day candle of pattern should open higher than first candle closing price and close lower than first candle opening price, thereby bears are in panic
Bearish Harami Pattern
Bearish Harami pattern has a smaller red candle within the body of the green candle.
- The current trend of the asset should be downtrend
- The first day candle of the Bearish Harami pattern should be a green candle confirming the bullishness in the market
- The second day candle of Bearish Harami pattern should open lower than first candle closing price and close higher than first candle opening price, thereby bulls are in panic
Engulfing Pattern is stronger than Harami Pattern
GAP BASED PATTERNS
Before learning Gap based patterns, as an intelligent investor we need to understand what is gap up opening and gap down opening. To get better understanding lets understand with an example. Imagine Nifty 50, our market index has closed trading at range of 18,000 at 3.30 pm. So, after our market has closed at 3.30 pm, global markets will still be trading and Nifty 50 will be trading in Singapore exchange as well (SGX NIFTY). The global trading sentiments will be influenced at the next day market opening at 9.15 A.m. if the global trading sentiments is positive, we can see a gap up opening next day from the previous day close. Similarly, if global trading sentiments is negative, we can see a gap down opening next day from the previous day closing.
Gap Up Opening
Gap up opening means that the Market is opening at an upper range than previous day closing. A gap up opening in market indicates the global positivity as well as buyer’s enthusiasm.
• Shows bullish sentiment
Gap Down Opening
Gap down opening means the marker is opening at a lower range than previous day closing .A gap down opening shows the global negativity and the enthusiasm of the bears to sell in the market
• Shows bearish sentiment
GAP BASED PATTERNS
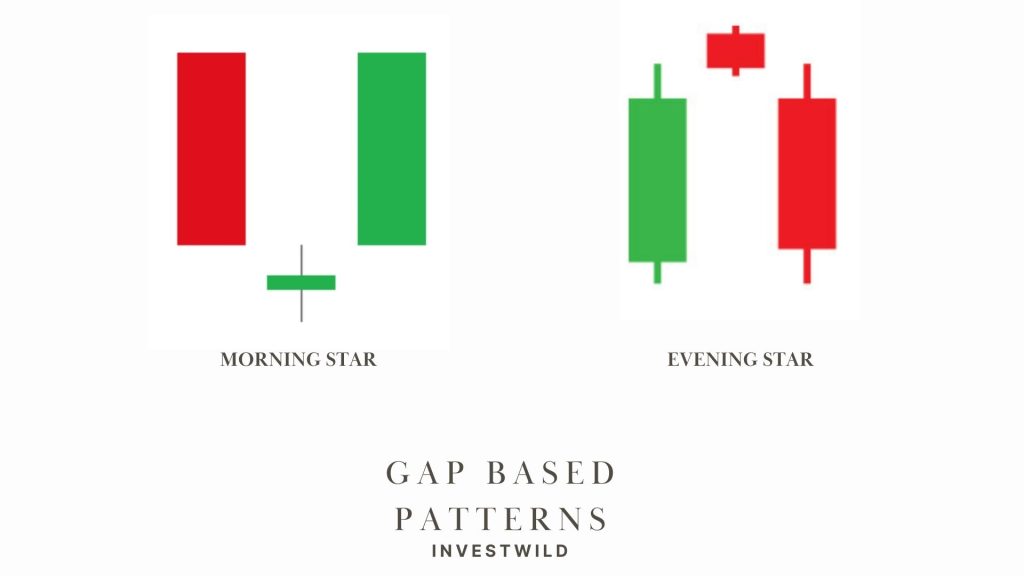
Gap Based Pattern is a three-candle pattern. The first candle is usually long, the second candle is a Doji or spinning top and third candle has a long body. Gap based patterns like morning star and evening star indicates trend reversal of an asset.
Morning Star Pattern
- The current trend of the asset should be downtrend
- The first day candle of Morning star pattern should be a red candle confirming the bearishness in the market
- The second day candle of Morning Star pattern should open gap down showing strength of bears. The candle should either a Doji or a spinning top indicating the indecision in market.
- The third day candle of Morning star pattern should open with a gap up and close above the open of the first candle indicating the bullish trend in market
Evening Star Pattern
- The current trend of the asset should be downtrend
- The first day candle of Evening Star pattern should be a green candle that confirms the bullishness in the market
- The second day candle of Evening Star pattern should open gap up than previous day closing indicating the strength of bulls. The second candle will be a Doji or a spinning top indicating indecision in market.
- The third day candle of Evening Star pattern should open with a gap down and close below the opening price of first candle indicating bearish trend in market.


