
MACD -MOVING AVERAGE CONVERGENCE DIVERGENCE
In Technical analysis, Moving Average Convergence Divergence (MACD) is the most effective and useful technical indicator for understanding the trend and momentum of an asset in trading. MACD indicator helps investors and traders to identify potential buying and selling zones to make intelligent trading decisions. MACD indicator has to be clubbed with market conditions and other trading indicators for better trading outcome. MACD indicators is also used by traders to identify bullish divergence and bearish divergence. Divergences happens when the MACD line diverges from price of underlying asset. Traders and investors are able to identify these divergences and can make informed decisions in market. A bullish divergence happens when the price of an asset makes a lower low and the MACD line makes a higher low. Similarly, a bearish divergence happens when the asset’s price makes a higher high and MACD line reaches a lower high. Understanding Moving Average technical indicator helps investors and traders to learn MACD indicator easily.
- MACD is the simplest and most effective momentum indicators used in the market.
- MACD indicator is a leading indicator.
- Shows trends and strength/weakness
Consists of 3 components: (Most common setting 26,12,9)
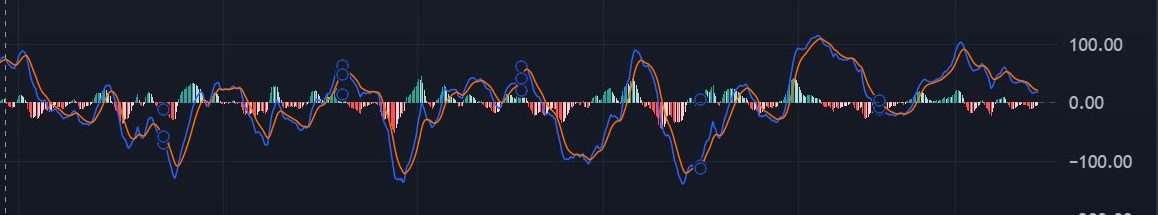
- MACD Line – MACD line in MACD indicator is the difference of 12 days EMA and 26 days EMA – Fast Line (Shows strength and weakness)
- Signal Line -9 period EMA of MACD line – Slow Line
- Histogram – shows difference between MACD line and Signal line
MACD is all about the convergence and divergence of these 2 lines
HOW DOES MACD WORK?
The MACD line oscillates above and below the zero line, commonly referred to as the center line.
- MACD indicator initiates a buy signal when the MACD line has crossed the signal line above the central line.
- MACD line crossing over the signal line and moving down gives a sell signal
- Positive MACD indicates that the 12 days EMA is above the 26 days EMA.. This shows strength in price. This means upside momentum is increasing and this indicates that there are higher chances for the asset to move up.
- Negative MACD indicates that the 12 days EMA is below the 26 days EMA. Negative value increases as the shorter EMA diverges further below the longer EMA. This shows weakness in price. This means downside momentum is increasing and there is higher probability that the price of the asset will move down.
- MACD line crossing over the signal line and moving up gives a buy signal
MACD TRADING STRATEGY
Let’s understand MACD technical indicator with a live example of Nifty 50 trading chart. In the image blue line represents the MACD line and orange line is signal line. Histogram is also clearly visible in the image.
BUY SIGNAL IN MACD INDICATOR
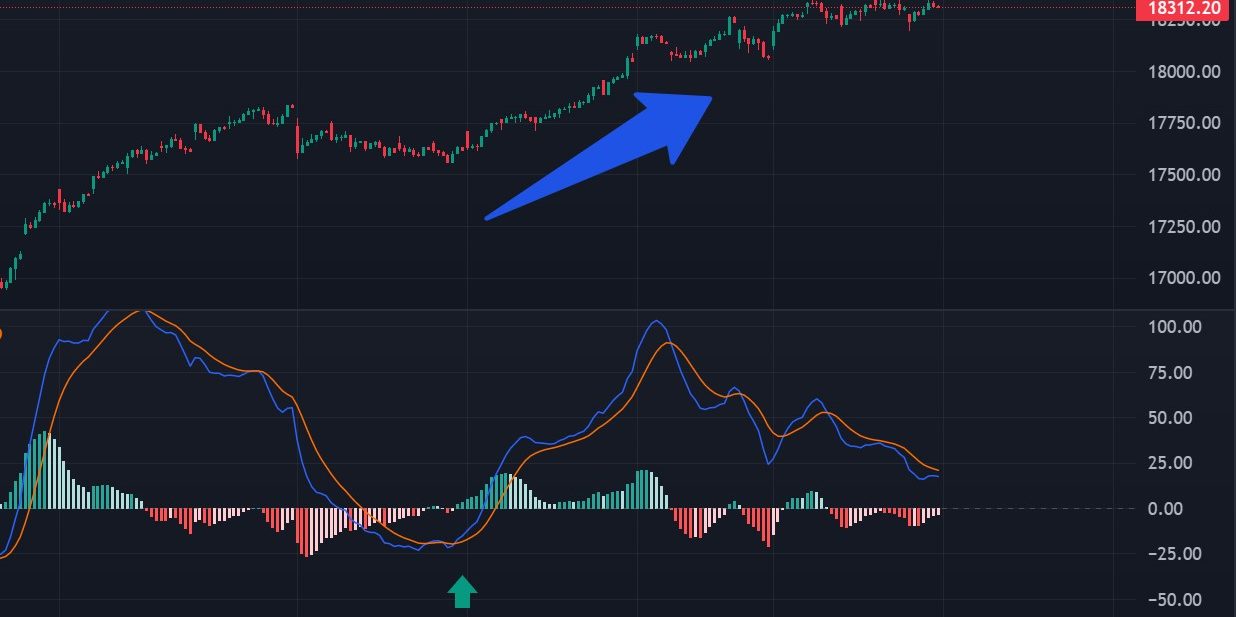
As we have learned earlier, when the MACD line cross over the signal line, MACD indicator initiates a buy signal. Let’s look at the Nifty 50 chart image for more understanding. In the image we can clearly see that after the MACD indicator showed a buy signal, Nifty 50 has been moving up strongly. As MACD is a leading indicator, the indicator provides a buy signal before the movement happen. This helps the trader to take high probable and informed trading decisions.
SELL SIGNAL IN MACD INDICATOR
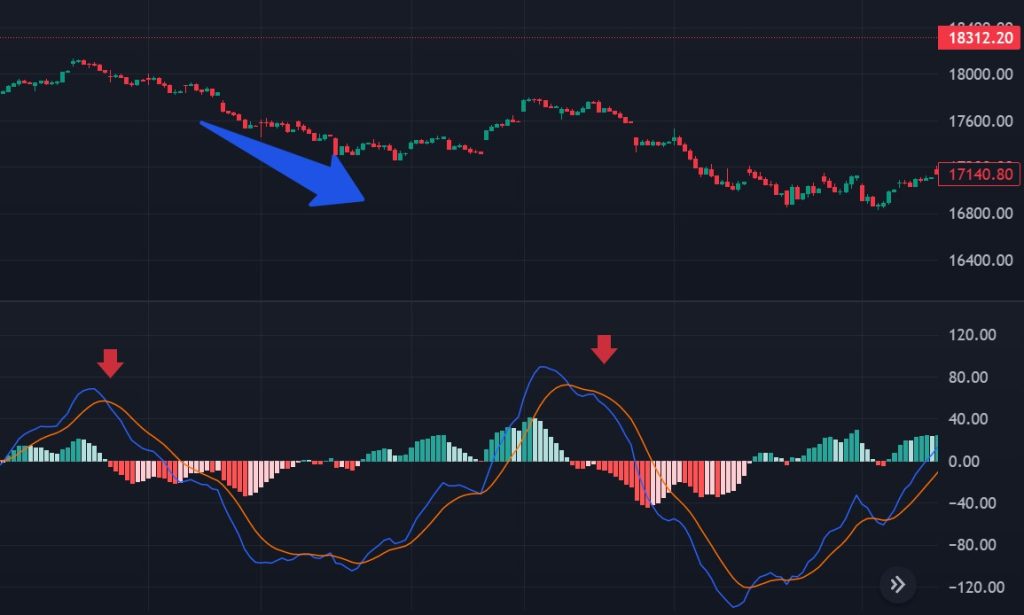
When the MACD crosses down the signal line, the MACD indicator will initiates a sell signal. In the image we can see whenever the MACD indicator has initiated a sell signal, the price of the underlying asset has been moving down strongly. When the MACD indicator indicates a sell signal the traders can enter into a short positions and investors can consider booking profits or losses in market. MACD is a reliable momentum indicator but has to be used with other indicators to make high probable trades in market.
IMPORTANT -All Analysis are shared for educational purpose only. Please don’t take this as a buy recommendation.