
What is a Chart pattern in financial market?
Chart patterns provide a visual representation of price movements in financial markets. Market participants use patterns to identify potential trends, reversals, and other market conditions to enhance their trading journey. It is relevant for traders to keep a great risk management to procure invested capital and to remain profitable in the long term. Traders must matter different types of patterns and the logic behind it to take intelligent trading decisions in stock market. Different types of chart patterns are
- Trend reversal chart pattern
- Trend continuation chart pattern
- Bilateral chart patterns
Trend Reversal chart patterns in financial market
Trend reversal chart patterns provide a visual representation about the market sentiment indicating the trend reversal in an asset. These patterns are formed when an uptrend or downtrend is about to end. Market participants can use trend reversal patterns to exit their holding or to enter a new position. Let’s understand trend reversal pattern in detail to get a better understanding about the financial market.
Double top and Double Bottom
- Double bottom and double top pattern suggest a potential trend reversal in asset price.
- Chart pattern is formed when the asset price reaches important support levels or resistance levels.
- In double top the neck line is the support level taken by the two top formation in the pattern.
- In double bottom the neck line is the resistance level taken by two bottom formations in the pattern
Double Top chart pattern
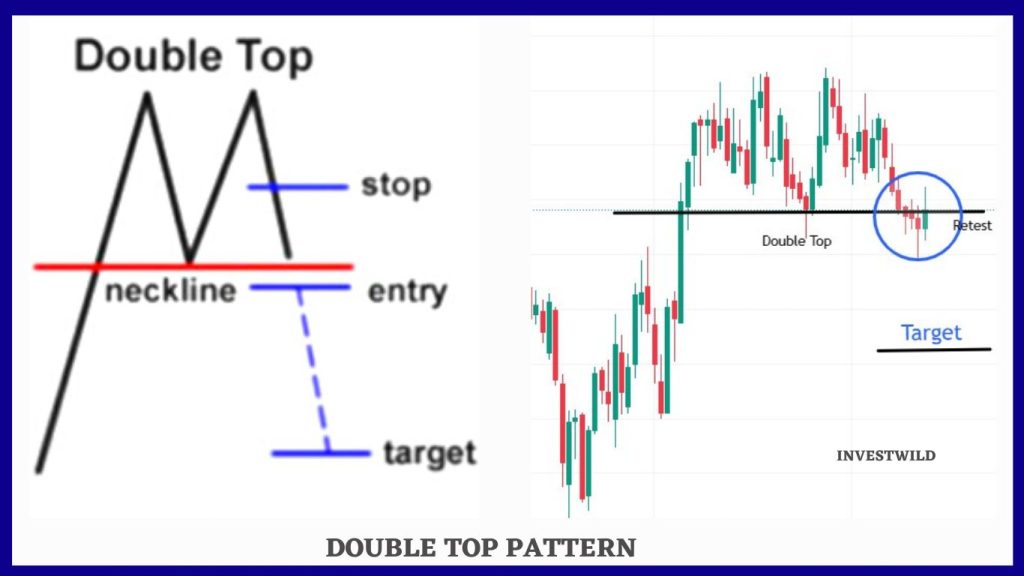
This pattern is formed during an uptrend. It consists of two highs that are unable to break the resistance level. This pattern is formed in an uptrend near a resistance level which indicates that the momentum and strength in the asset is about to end. Market participants can either exit their long position or can enter a new short position when the double top chart pattern is formed.
In conclusion the double top pattern gives an indication about potential trend reversal from bullish to bearish. Traders must use other technical indicators to avoid false break outs and to generate better trading outcome.
Double Bottom
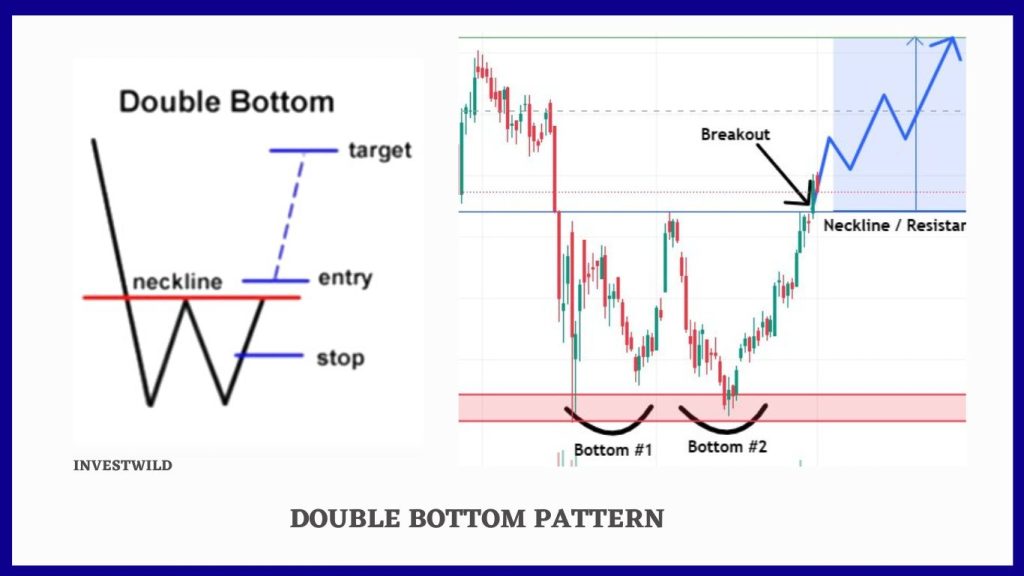
Double bottom pattern is a bullish reversal pattern that is formed in a down trend. This pattern consists of two similar lows that are unable to break the support level in a downtrend. It indicates that there is high potential for the asset price to reverse from bearish to bullish trend. Market participants can either exit their short position or can enter a new long position when the double bottom chart pattern is formed. Traders must wait for a trend reversal confirmation with other technical indicators to take high probable trades.
Head and shoulders pattern
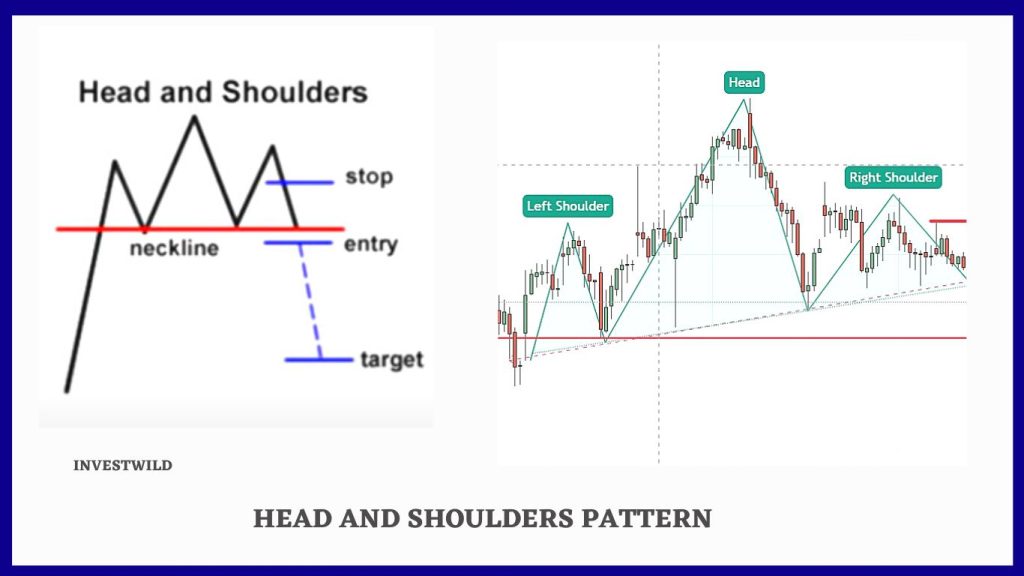
Head and shoulders pattern is a commonly used trend reversal pattern. The pattern will have three highs. The middle one will be higher than other two being the head and other two looks like a shoulder with almost similar height. Head and shoulder pattern occurs during an uptrend indicating there will be trend reversal to bearish. Traders can wait for the asset price to break the neck line of the pattern to enter a new short position or to enter a new short position.
- The neckline acts as a support level that connects the lows between the left and right shoulder and the head.
- The head of the head and shoulders pattern is the highest peak that forms in the middle of the pattern which provides a visual representation of a head.
- The left and right Shoulder will be almost similar in height and forms in both sides of the head.
Inverse head and shoulder pattern
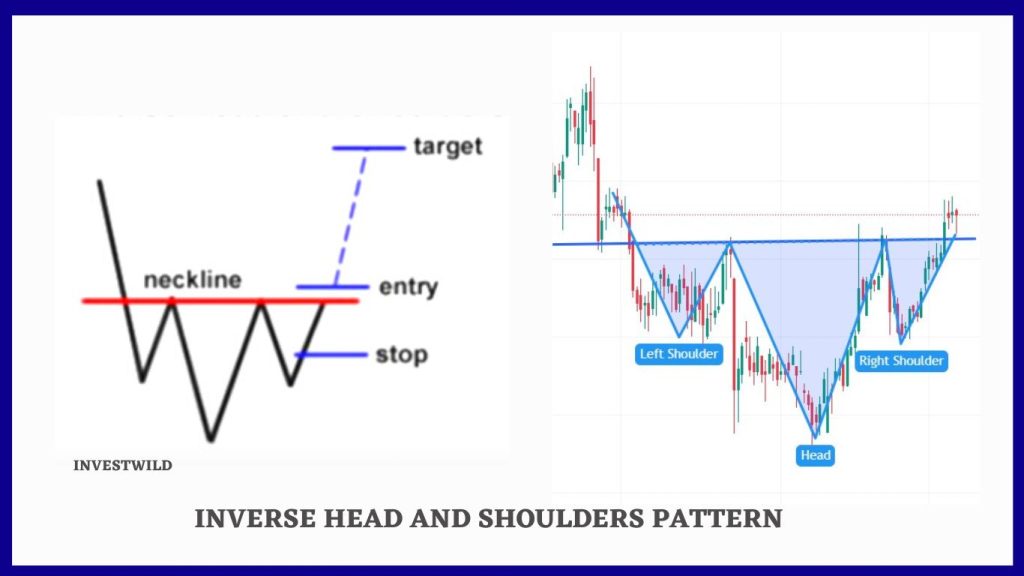
The inverse head and shoulders pattern is formed in a downtrend which indicates trend reversal from bearish to bullish. The pattern will have three highs similar to head and shoulders pattern and the middle one will be higher than other two highs. The left and right peaks will be almost similar heights being the shoulder and the middle one provides a visual representation of a head. Market participants can wait for the neckline to break to confirm trend reversal to enter a long position in an asset.
- Neckline in inverse head and shoulder pattern is the resistance level connecting the highs between the left and right shoulder and the head.
Falling wedge and Rising Wedge
Wedge chart patterns can be considered as a trend continuation chart pattern and trend reversal chart pattern depending on the trend the pattern is formed.
- Falling wedge and Rising wedges has converging trend lines
- In a rising wedge the upper trendline connects higher highs and lower trendline connects higher lows.
- In a falling wedge the upper trendline connects lower highs and lower trendline connects lower lows
- Falling wedge pattern is formed in a down trend.
- Rising wedge pattern is formed in an uptrend.
Falling wedge
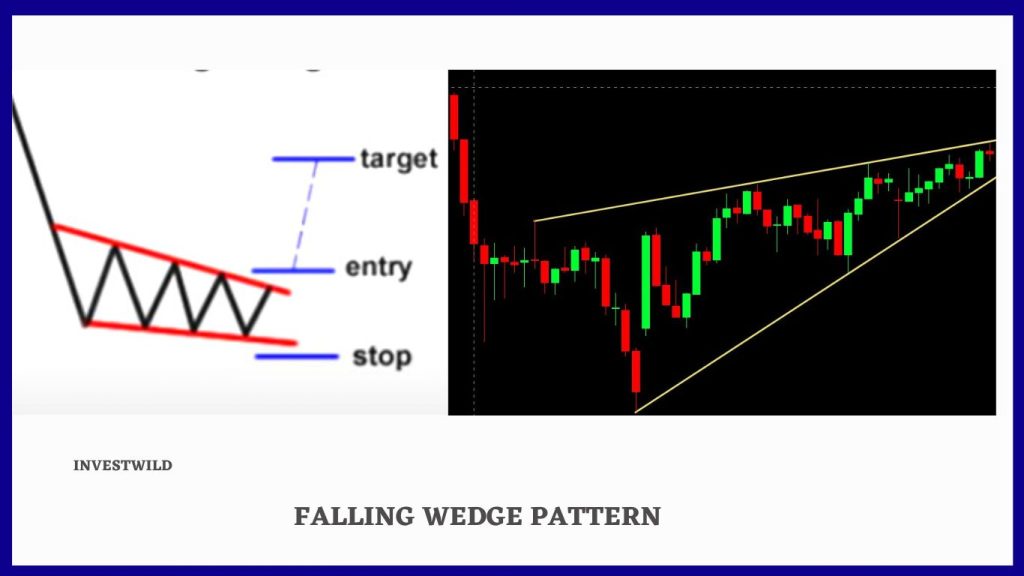
Falling wedge pattern is formed after a down trend followed by converging trendline consolidation. The pattern can act as a trend reversal pattern and trend continuation pattern depending on which trendline the asset price breaks. If the asset price breaks the upper trend line of the falling wedge pattern it indicates trend reversal to bullish. If the asset price breaks the lower trend line, there is high probability for the asset to continue the downward momentum. Market participants can wait for the asset price to break the trend line to confirm the trend and can take informed decisions accordingly.
Rising Wedge
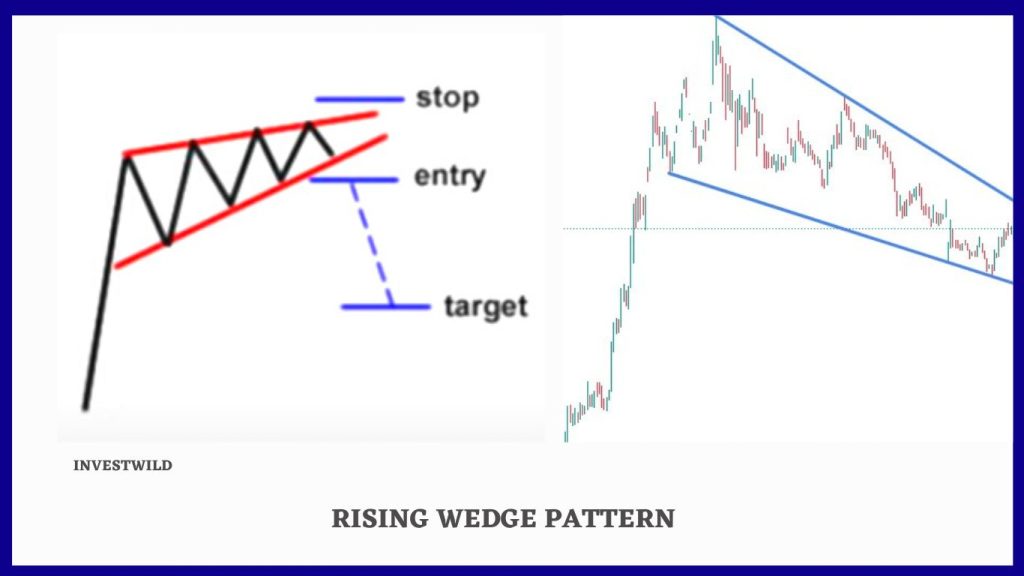
Rising wedge pattern is formed during an uptrend followed by a converging bearish trend line consolidation. It indicates that there is potential for a trend reversal from bullish to bearish. Trend in the asset depends on which trend line the asset price breaks. If the asset price breaks the lower trend line, there will be a potential trend reversal and traders can enter a short position. If the asset price breaks the upper trend line, there is high probability for the asset to continue to bullish momentum.
Triple top and Triple bottom
Triple top and triple bottom patterns are trend reversal patterns that are usually formed at the support level or resistance level of an asset price. It indicates weakness in asset and there is high probability for a trend reversal.
- Neckline in triple top pattern is the support level taken by the asset price in the pattern.
- Neckline in a triple bottom pattern is the resistance level taken by the asset price in the pattern.
- Indicates that asset is losing strength to maintain the current trend and potential for trend to reverse
Triple Top chart pattern
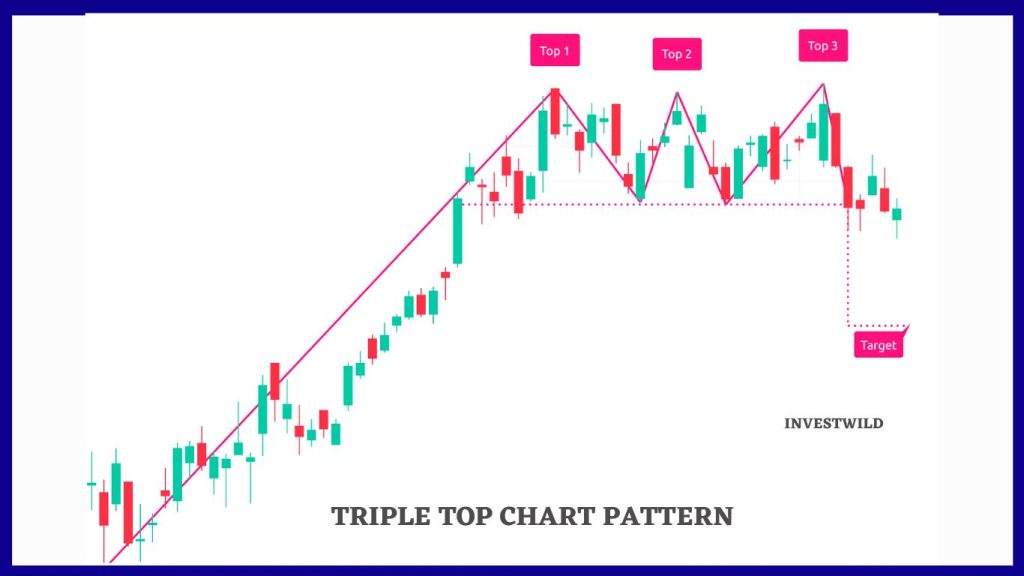
Triple top pattern is a bearish trend reversal pattern that is formed in the resistance level of an asset price during an uptrend. A triple top pattern is formed when an asset fails to break the resistance three times. Every time the asset price tries to break the resistance, a high will be formed. Market participants can wait for the Triple top pattern to break the neckline support to enter a short position.
Triple Bottom chart pattern
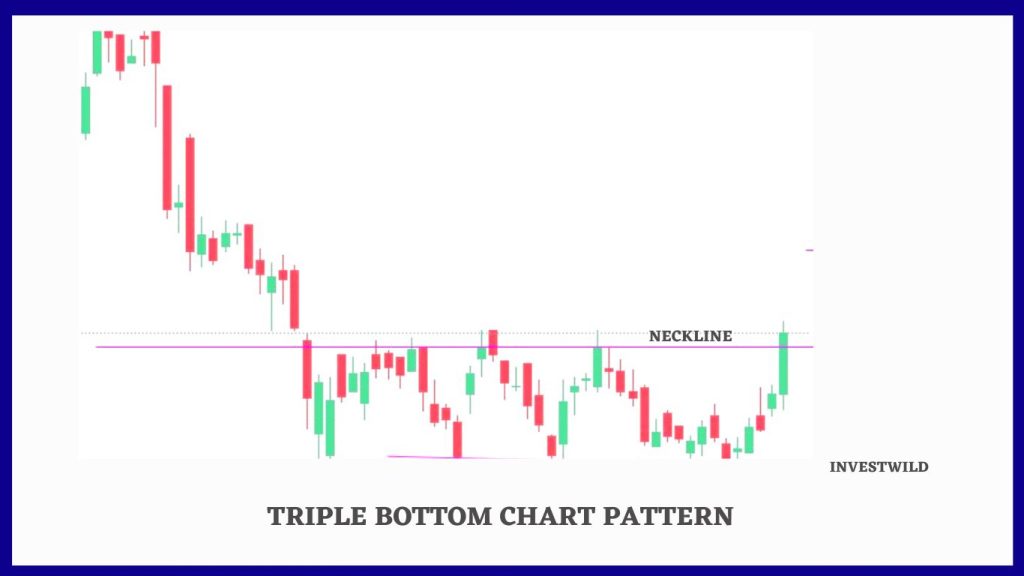
Triple bottom pattern is a bullish trend reversal pattern that is formed in the support level of an asset during a downtrend. This chart pattern is formed when the asset price fails to break the support level three times. Every time the asset price fails to break the support, a bottom will be formed. Market participants must wait for the neckline resistance to break for entering a long position.
Rounding Bottom Chart pattern
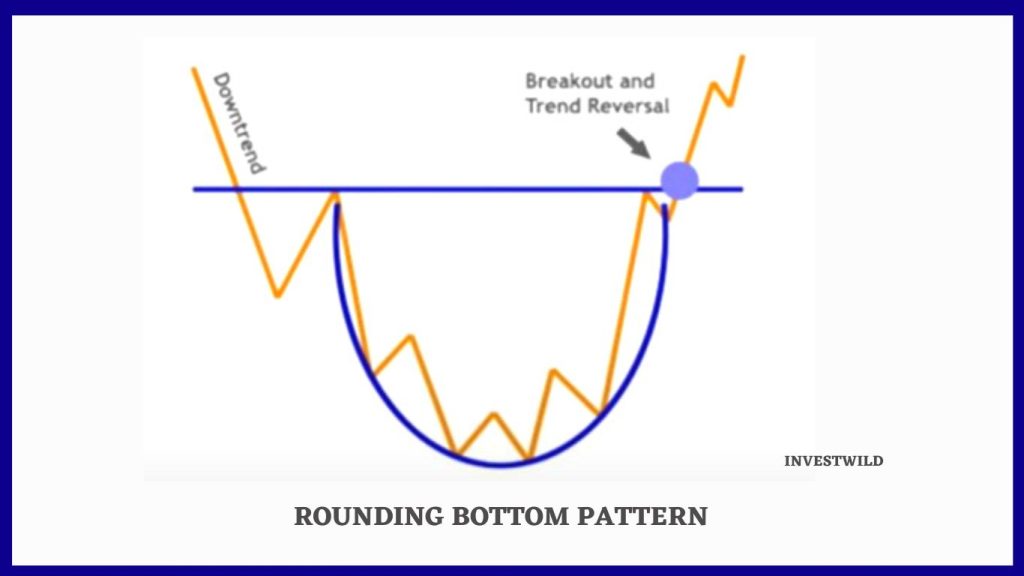
Rounding Bottom chart pattern is a bullish trend reversal chart pattern which is formed during down trend in an asset. It indicates that the down side momentum is about to end and there is a potential for a trend reversal. The rounding bottom pattern looks like the U alphabet.
Market participants can wait for the asset price to break the neckline resistance in the pattern to confirm the breakout. Using other technical indicators like Moving average, MACD, RSI helps traders to re confirm the trend to avoid false breakouts.