
Understanding Trend
Understanding the trend is relevant in technical analysis as it helps the traders and investors to determine the movement and trend of a financial instrument and can take intelligent decisions in market. By identifying trend of any asset, investors and traders can determine the trend of a stock, which means they can understand whether the stock is in an uptrend, consolidation or in a downtrend. For example, imagine that you are a novice investor and want to make an investment decision. In that situation understanding the buying and selling price of a stock or asset will be difficult for you. By mastering technical analysis anyone can understand the trend of an asset and can make financial decisions accordingly. We can buy an asset when it is an uptrend and can sell when it is in a downtrend. By proper trend analysis traders are able to identify potential trading opportunities in market and is able to generate an income from it. Understanding the trend of an asset and keeping your trading positions along with the trend helps traders to avoid complicating the market and can avoid making huge losses.
- Direction of price movement in a particular time frame is called Trend
- Use trend to take position at right times. Most lose money because they go against Trend
- Always Trade with Trend. Trend is Your Friend. Always keep in mind to not to trade against trend.
- Identify trends in suitable time frames for fruitful trades
UP TREND
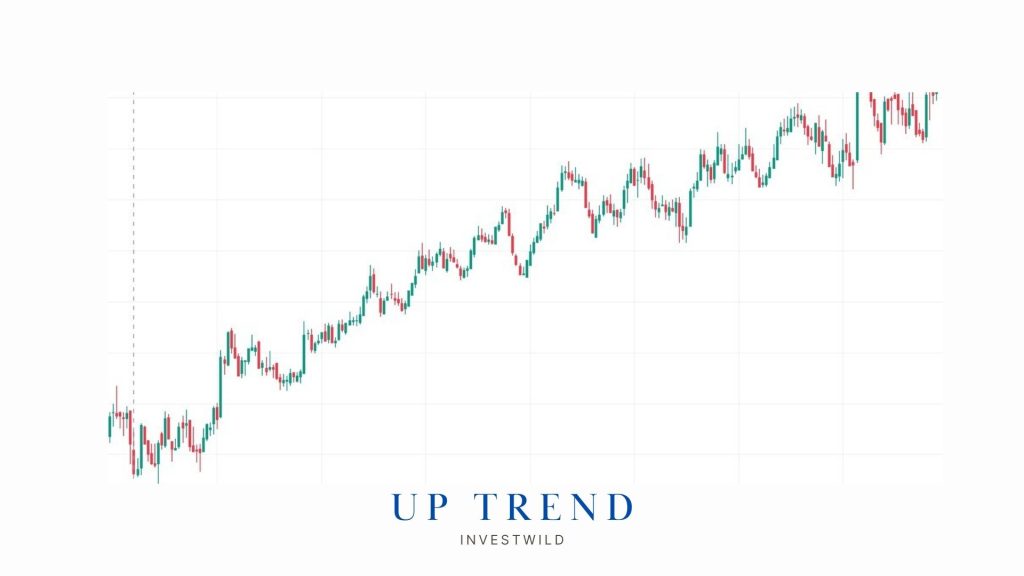
Over the time of the price of the asset is moving upwards making higher highs and higher lows we can understand that the asset is in an uptrend. For example, if the price of a stock is moving up creating higher highs and higher lows, the stock is now in an uptrend and as an investor and trader we can consider buying that stock and hold it till there is a trend reversal. Uptrends in an asset indicates the buying momentum in the asset and factors that creates a bullish investor sentiment are positive earnings reports, good news about the industry or company, strong economic data etc.
- Price is moving up eventually in a particular time frame
- Higher Highs and Higher Lows
- Buy at Higher Lows
- Do not short during Up Trend
DOWN TREND
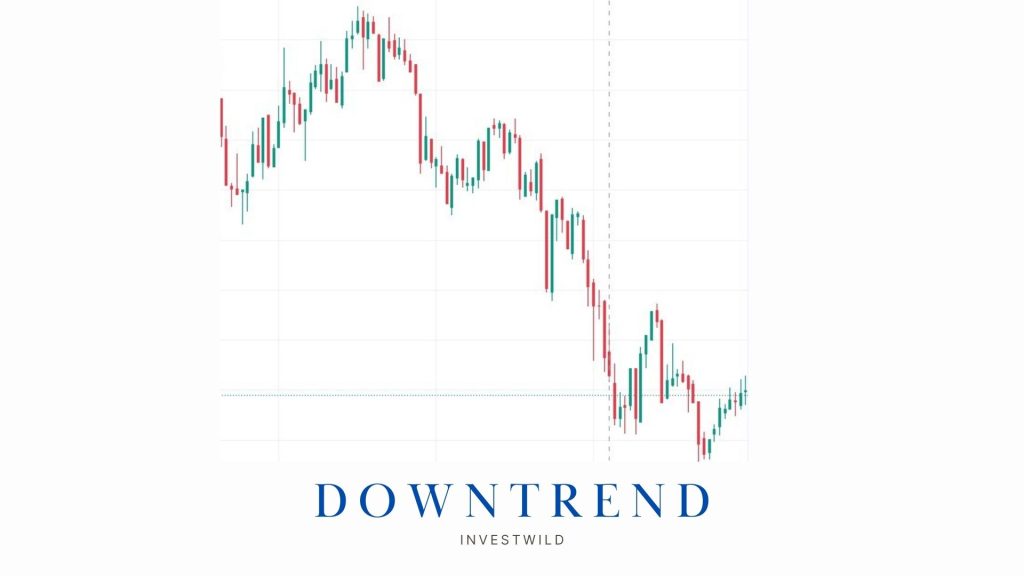
If the price of a stock is declining over a time creating lower highs and lower lows, we can understand that stock or any asset is in a downtrend. For example, if you are analyzing a stock and can see that the stock is moving down creating lower highs and lower lows, you can realize that the stock is in a down trend and can avoid buying stock when it is in a selling momentum. Traders or investors has to wait for the stock in a downside trend to find its bottom and when trend reversal happens to uptrend traders and investors can consider buying it. Traders are able to make intelligent decisions by understanding the trend if a stock. Major factors that can create selling pressure in stock are negative earnings reports, unfavorable news about the industry or company, weak economic data etc.
- Price is moving down eventually in a particular time frame
- Lower Lows and Lower Highs
- Short at Lower Highs
- Do not buy during Down Trend
CONSOLIDATION / SIDEWAYS TREND
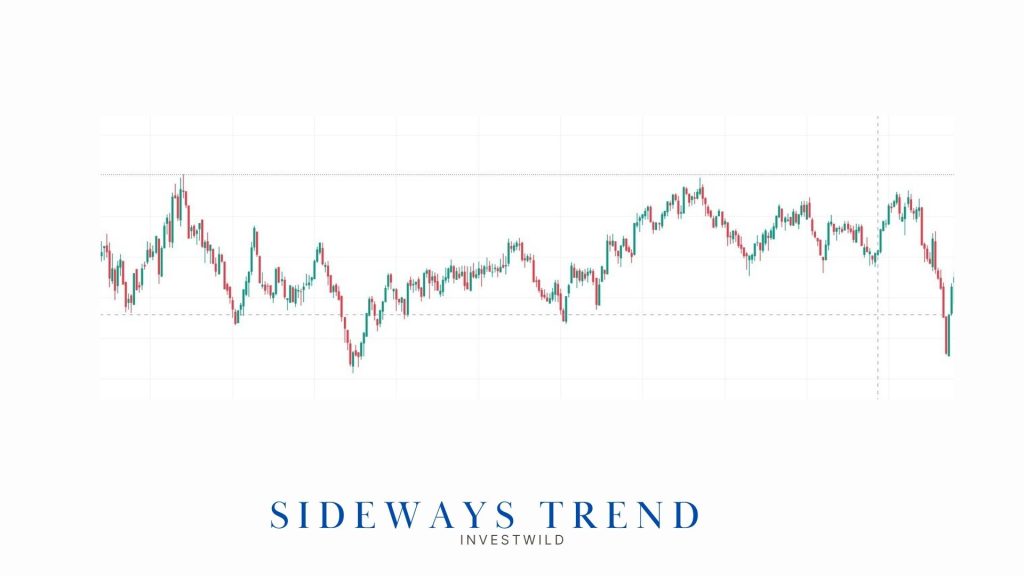
When the stock or asset is in a range bound movement without a clear direction, we can understand that the asset is in a consolidation of sideways trend. In a consolidating market the highs and lows created by the asset will be almost similar. The asset is bound to consolidate in between the support and resistance zone. The direction of the asset depends upon breaking the support or resistance. If the resistance is broken the asset is bound to move up from there and is called a Break out. If the resistance is broken the asset will move down from the sideways trend and is called a Break down. Sideways trends or consolidating market is caused by factors such as uncertainty in the market, expectation of significant news or events, indecision among investors.
- Price is consolidating in a particular time frame
- Similar Lows and Similar Highs
- Do not buy or sell during Sideways Trend
- Wait for the stock to break out from range and take position accordingly